ITSM Reporting Metrics: The KPIs That Matter and How to Report Them



Discover the ITSM metrics that matter most—and how focused, action-oriented reporting can turn service data into better decisions.
Effective IT service management depends on visibility, and visibility depends on measurement. Reliable reporting gives IT teams a factual basis for decisions and replaces assumptions with evidence. This article explains the core measures, clarifies how they differ from KPIs and service targets, and shows how to report them so every audience receives information that drives action.
ITSM metrics are quantitative measures of how well IT service management processes perform. They track activity across incident management, problem management, change management, and service request management, then express performance as numbers that teams compare over time.
Within IT service management, these metrics provide a quantitative view of service delivery and quality. ITSM metrics provide a shared language for operations and leadership. In short, they reflect the performance of IT service management as a whole, and ITSM metrics serve as the foundation for reporting and improvement.
Reported figures differ from raw operational data. They are curated: specific metrics chosen because they answer a business question. The right metrics keep reporting concise, while too many measures without focus dilute attention and obscure what actually matters.
A metric is any measurement. Key performance indicators, or KPIs, are measurements that directly reflect progress toward a goal. All KPIs are metrics, but the reverse does not hold. Choosing the right indicators means separating operational measures from strategic indicators.
A service level agreement, or SLA, is a commitment between IT and the business, for example resolving an incident within its agreed target. Operational level agreements support SLAs internally, while underpinning contracts cover external suppliers and the wider service level.
Experience level agreements extend this further by measuring user experience and perceived value, not only technical compliance. Together, metrics and KPIs, alongside SLAs, OLAs, and XLAs, describe both what IT delivers and how users feel about it.
ITSM measurement supports operational and strategic needs at once. Metrics that provide context help managers allocate staff, while figures tied directly to cost and risk inform executives. Tracking metrics consistently turns reactive support into a measured, predictable function.
Strong reporting demonstrates the value of IT. These figures provide the evidence to justify budget, prove workload, and align with business priorities. Metrics can help leadership see where investment improves service performance, and consistent measurement can lead to better resource management across teams.
When these measures align with business goals, IT stops being a cost center and becomes a contributor. The benefits of ITSM measurement include faster decisions, fewer service disruptions, and a clear connection between IT activity and outcomes across all ITSM processes.
The following metrics represent the essential ITSM metrics most organizations report. These key ITSM metrics, together with a few other important ITSM metrics, give a balanced picture of service health and a sensible starting set of metrics to track.
The summary table of core service management metrics below lists each measure, what it tracks, and why it matters. Treat it as a starting point, not a fixed mandate.
| Metric | What it measures | Why it matters |
|---|---|---|
| MTTR (mean time to resolve) | The average time to resolve an incident | Speed of recovery and incident response |
| First response time (FRT) | The average time before the first reply to a service request | Responsiveness to users |
| CSAT | Customer satisfaction with a support interaction | Service quality from the user view |
| First contact resolution (FCR) | The percentage of incidents resolved at first contact | Efficiency and user satisfaction |
| SLA compliance | The share of tickets resolved within the agreed SLA | Reliability of service delivery |
| Incident volume | The number of incidents over a period | Workload and demand |
| Change success rate | The percentage of changes completed without failure | Quality of the change management process |
| Service availability | The percentage of uptime for critical systems | Stability and minimized downtime |
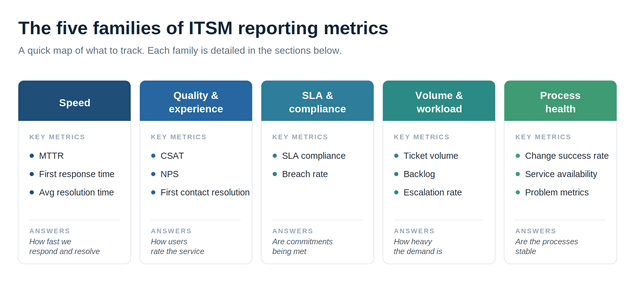
Speed indicators show how quickly IT acts. Response time measures the average time before a technician first replies to a service request or incident. Resolution time, reported as MTTR, captures how long it takes to resolve and close the issue.
Average resolution time reveals bottlenecks. A rising resolution time signals capacity or process problems. Teams use these response time figures to set realistic SLAs, speed up incident response, and balance workload across the service desk.
Incident resolution time and service availability are frequently reviewed side by side, because slow recovery often coincides with reduced uptime and longer response time for waiting users.
Quality indicators capture how users perceive support. Customer satisfaction and user satisfaction surveys score individual interactions, while Net Promoter Score measures loyalty. Metrics like customer satisfaction translate technical performance into the language of user experience.
First contact resolution is a quality and efficiency measure. It measures the percentage of incidents resolved at first contact, without escalation, improving overall service quality. A high resolution rate here correlates with higher customer satisfaction.
Resolution rate and service quality move together. When it climbs, perceived quality usually follows, which is why these quality indicators deserve prominent placement in every report.
SLA compliance is among the most reported ITSM indicators. It tracks the share of tickets resolved within the SLA target. Consistent SLA compliance signals reliable service delivery and a service desk that meets its commitments.
Track breaches alongside compliance to expose systemic risk. A declining trend often points to understaffing or unrealistic targets. Pair this measure with response time and resolution time to judge whether the service level itself is achievable.
Volume indicators quantify demand. Incident volume, total ticket count, and backlog reveal whether the team can keep pace. A growing backlog with stable staffing predicts future SLA risk and staff burnout.
Escalation rate exposes process gaps. High escalation means first line support cannot resolve issues, while reducing overall incident volume through problem management lowers cost. These operational measures guide staffing and shift planning across the organization.
Process health indicators track the discipline behind day to day operations. This indicator measures the percentage of changes implemented without causing an incident or rollback. A strong result reflects effective change management and a mature change management process.
Service availability measures the percentage of uptime for critical systems and helps teams minimize downtime. Problem indicators, produced by the problem management process, track recurring incidents and root cause elimination, which steadily reduce future volume.
Collecting data is only half the task. Reporting turns measurement into decisions. Effective reporting within IT operations matches content, format, and frequency to the audience, so each reader sees the data that matters to their specific role.
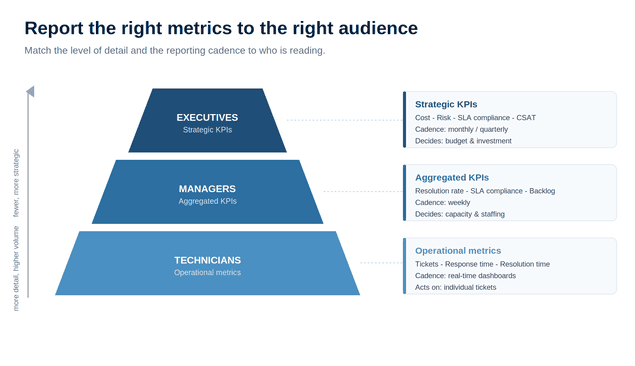
Different audiences need different views. Technicians need operational metrics such as open tickets, response time, and incident resolution time. They act on detail in near real time and resolve issues directly.
Managers need aggregated KPIs such as resolution rate, breach rate, and backlog trends, so they can manage capacity. Executives need strategic KPIs tied to business goals, cost, and risk. Reporting the right measures to each level prevents overload and keeps attention focused.
Manual reporting from spreadsheets is slow and error prone. Modern ITSM tools automate collection, calculation, and distribution, so teams spend time acting on data rather than assembling it. An integrated ITSM platform ties tickets, assets, and changes to the figures they generate.
Alloy Software offers exactly this kind of integrated ITSM solution. Our flagship all-in-one solution for ITSM and ITAM Alloy Navigator combines service management, asset management, and an Interactive Analytics module with prebuilt dashboards and scheduled reports.
We’re trusted by IT teams in healthcare, public sector, manufacturing, and education across 50+ countries.
Measure ITSM performance by selecting a small set of indicators aligned to business goals, such as resolution rate, response time, and customer satisfaction. Collect data consistently across the service desk, report it by audience, and review trends to confirm that service delivery keeps improving over time.
Report the figures that connect directly to cost, risk, and business goals. Leadership values strategic indicators over raw counts, so present SLA compliance, customer satisfaction, and uptime. These figures provide the clearest evidence of value and guide investment decisions with confidence.
Match frequency to purpose. Use live dashboards for daily operational measures, weekly reports for team managers, and monthly or quarterly summaries for executives. Avoid reporting so often that the metrics to track lose meaning. A consistent cadence matters more than raw frequency for tracking ITSM trends.