Help Desk Metrics: Boring but Necessary
Learn how to choose, analyze, and track key help desk metrics to improve efficiency, service quality, and customer satisfaction.

Learn how to choose, analyze, and track key help desk metrics to improve efficiency, service quality, and customer satisfaction.
A help desk is the friendly face of a company, turned toward its customers. It is a virtual or physical place where people can seek assistance, ask questions, or leave feedback. From the customer’s perspective, a help desk typically consists of a library of reference information based on frequently asked questions and a communication channel to reach the customer support team.
In IT, a help desk is a support team that assists users with issues related to IT products and services. It helps troubleshoot software, hardware, and network problems, provides guidance on installation and configuration, and may also handle inquiries like account management or billing. IT help desks operate through various channels, including online portals, phone, and email, to ensure smooth operations and user satisfaction.
The term “help desk” is often used interchangeably with the term “service desk”. However, these desks have slightly different functions. A help desk focuses on providing technical support and troubleshooting for the customers. Its primary goal is to quickly resolve incidents and restore functionality. However, a service desk provides more of a strategic approach. It includes all the functions of a help desk but also focuses on IT service management (ITSM), handling service requests, managing IT processes, and aligning IT support with business goals. It is a tool for analyzing problems and incidents and implementing changes.
Read more about the difference between the help desk and the service desk in our article.
One of the main reasons to implement service desk metrics is to track the processes within your company’s workflow. You can monitor and evaluate each employee’s KPIs, the productivity of different teams, the volume and distribution of workload, and the financial costs of handling tickets. This provides an opportunity to dive into the specific details of your company’s operations, collect and analyze different types of data, and assess which strategies are proving successful.

Help desk metrics can be a helping hand in identifying areas for improvement within your company’s processes. By analyzing key data such as first response time, resolution time, support tickets opened vs solved, you can pinpoint inefficiencies and optimize workflows. Furthermore, understanding the performance of individual employees and teams enables you to offer targeted training and support, enhancing overall productivity. By regularly reviewing help desk metrics, you can continuously refine your processes and ensure that your company operates at peak efficiency.
Help desk metrics improve customer satisfaction by highlighting the quality of service. Monitoring metrics like customer effort score, net promoter score, and customer satisfaction score helps identify areas for improvement. Regular analysis of feedback and performance allows for adjustments in support strategies and communication, leading to stronger customer loyalty and getting positive reviews.

First response time tracks the time taken for the help desk to send the initial response after a ticket is submitted. It indicates the reaction speed of the IT team, and how quickly they start working on new tickets.
Formula: First response time = Time of first ticket reply − Time the first ticket was opened
👍 A lower first response time indicates that customers hear back from the team quickly about their request, improving satisfaction.
👎 A higher first response time can result in accumulation of users’ dissatisfaction and even possible customer churn.
❗ Note that certain metrics are interpreted in reverse! For example, a higher first response time typically signals a negative outcome, whereas a lower value suggests a timely response from support agents.
First contact resolution reveals the percentage of tickets resolved in the first interaction. It reflects efficiency in dealing with issues without follow-ups or escalations.
Formula: First contact resolution (%) = Total contacts resolved on first contact ÷ Total contacts × 100.
👍 A high first contact resolution rate indicates well-trained agents and effective troubleshooting processes, which reduce the need for multiple customer interactions.
👎 A low first contact resolution rate suggests inefficiencies in troubleshooting or a lack of agent training, leading to more follow-ups, escalations, and longer resolution times.
Time to resolution indicates how long it takes to fully resolve a ticket from the moment of first response until closure. It helps monitor the help desk’s efficiency in handling and resolving issues.
Formula: Time to resolution = Total sum of (Resolution End Time - Resolution Start Time) ÷ Total number of resolved tickets
👍 A low resolution time suggests that issues are being resolved quickly, suggesting efficient workflows, well-trained agents, and effective troubleshooting processes. However, if time to resolution is too short, it indicates rushed resolutions that could compromise service quality.
👎 A high resolution time reflects delays in resolving customer issues, which signal complex ticket handling, inefficient processes, understaffing, or a need for better agent training. It leads to customer dissatisfaction and increased backlog.
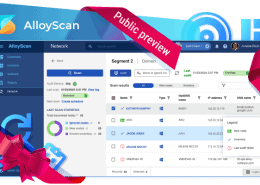
In Alloy Navigator, our comprehensive ITSM and ITAM solution, you not only have dashboards, but also convenient ticket views. Ticket views offers a visual representation of your team’s performance—an alternative to traditional reports. Define formatting rules for columns, rows, and cells based on status, assignee, or other criteria, making it easy to spot critical areas in your ticket list. Additionally, you can export any view, fully or partially, as a CSV file to share with stakeholders or integrate into external reporting applications.
See our new grids in action in a YouTube guide:

Ticket volume tracks the sum of all tickets received by the support team within a specific time frame (e.g., daily, weekly, monthly). While this metric might seem simple at first, it requires careful interpretation—both high and low values can indicate positive or negative outcomes depending on the context.
Formula: Ticket volume = Just add up all the tickets received during a period of time you need
👍 High ticket volume may indicate that the team is effectively handling a growing user base without increasing backlogs and the help desk does its job well encouraging users to report issues rather than struggling with them.
Low ticket volume could suggest that the team has successfully minimized recurring issues through proactive problem management.
👎 High ticket volume may signal the team is struggling to handle the influx efficiently, leading to long resolution times or backlogs. It could also point to a sudden spike due to a service failure, showing instability in the system.
Low ticket volume might indicate that users avoid submitting tickets due to slow response times or a lack of confidence in support, resulting in unreported and escalated issues.
Tickets per agent is a workload metric that reflects the number of tickets assigned to each support agent over a specific period. It helps evaluate how ticket volume is distributed among agents.
Formula: Tickets per agent = The number of tickets assigned to an agent during a period of time you need
👍 Even ticket distribution indicates that workload is shared fairly, preventing overload and helping maintain high-quality resolutions.
👎 A large difference in tickets per agent reveals that workload isn’t balanced—some agents are overwhelmed and losing quality, while others are underutilized.
Support tickets opened vs solved compares the number of new tickets created to the number of tickets resolved within a certain period. It reflects how the help desk keeps up with incoming requests.
Formula: Support tickets opened vs solved = Tickets that were resolved during a certain period ÷ Number of requests that were opened in that period
👍 If the number of opened tickets doesn’t significantly exceed closed ones, agents are managing workloads efficiently and resolving issues on time. The backlog stays under control.
👎 When significantly more tickets are opened than solved, issues pile up, causing delays and frustrated customers. If this trend continues, a growing gap signals that the support team is struggling—possibly due to high ticket volume, inefficient processes, or a lack of staff.

Customer satisfaction score (CSAT) reveals how satisfied customers are with the support they receive. The data is collected through post-interaction surveys, where customers rate their experience on a scale (e.g., 1 to 5 or 1 to 10).
Formula: Customer satisfaction score = Number of positive responses ÷ Total number of responses
👍 A high CSAT indicates positive customer experiences and effective problem resolution.
👎 A low CSAT signals that some work should be done to improve your help desk team’s client communication skills.
If you need advice on how your service team can effectively assist a frustrated client, check out our article about conflict de-escalation in customer support.
Net promoter score (NPS) helps monitor customer loyalty by asking how likely they are to recommend the company’s services to others. Customers respond to this simple question on a scale from 0 to 10, evaluating their eagerness to recommend a service.
Formula: Net promoter score: promoters (9-10), passives (7-8), or detractors (0-6)
👍 A high NPS reflects strong customer trust and satisfaction.
👎 A low NPS points out that customer loyalty needs to be enhanced.
Customer effort score (CES) indicates how much effort a customer has to make while resolving their issue with a help desk agent. CES surveys typically ask the question, “on a scale of ‘very easy’ to ‘very difficult’, how easy was it to interact with [company name]?”
A low level of customer effort (“very easy”) is typically represented by a high score on the rating scale (read more on that in our disclaimer below).
Formula: Customer effort score = Total sum of effort scores ÷ Total number of responses
👍 High customer effort score suggests that the service is easy to use and the customers are more likely to stay engaged.
👎 Low customer effort score points out weak spots in client service such as inefficient problem resolution, unclear communication and long wait times.
Note that the scale that the company picks for evaluating CES may vary. Sometimes, a high level of customer effort (“very difficult”) is represented by a high score on the rating scale. In other cases, the lower the effort (the customer says that interacting with the team was “very easy”), the higher the score that this response receives. That is why interpreting and discussing CES might be tricky. Look at the CES survey form once again to understand how CES is evaluated and interpreted.


Transfer rate is typically tracked for the entire support team, reflecting the percentage of tickets that were transferred from one agent to another instead of being resolved on first contact. However, it can also be analyzed at the individual agent level to identify how frequently a specific agent escalates or transfers tickets.
Formula: Transfer rate (%) = Number of tickets transferred ÷ Total number of tickets x 100
👍 A low transfer rate points out that ticket routing is performed correctly and efficiently.
👎 A high transfer rate indicates inefficiencies in ticket routing. It shows that the choice of first-touch agent is often wrong.
Escalation rate reveals the percentage of tickets that were escalated to higher support or management levels. It helps track down how frequently the issues can’t be resolved by the initial support team and require more specific attention.
Formula: Escalation rate (%) = Number of escalated tickets ÷ Total number of tickets x 100
👍 Low escalation rate implies that the frontline agents can resolve most issues on their own.
👎 High escalation rate points out that frontline agents lack the necessary data base or sufficient instructions. Management struggles to set up effective processes, which leads to more frequent escalations.
Agent utilization rate denotes the ratio of the time a help desk agent spends on ticket-related activities to their total work time. This metric is specifically designed to assess the productivity and efficiency of help desk staff.
Formula: Agent utilization rate = Agent work time spent on tickets ÷ Total agent work time
👍 High utilization rate suggests that the team is using their working hours efficiently and doesn’t spend too much time on conference calls.
👎 Low agent utilization rate indicates that a certain agent or the whole team underperforms. On the other hand, an unreasonably high utilization rate signals need for better workload distribution or additional hires.
The first thing to look up to are the help desk goals that are important for your company. For example, response time matters when handling a high volume of tickets, while CSAT is crucial for service quality. The choice of metrics that suit you will depend on your business model, customer expectations, and operational goals.
Comparing to industry standards helps you evaluate your help desk’s performance and identify areas for improvement. By analyzing benchmarks, you can set realistic goals, ensure your team meets industry expectations, and adjust strategies to stay competitive.
Avoiding metric overload. Sometimes making too much effort can lead to poor results and confusion. Focus on a balanced set of key metrics rather than tracking everything, which can lead to unnecessary complexity and misinterpretation.
Leveraging automation and reporting tools can help streamline the process of collecting, analyzing, and reporting on your data. Tools like analytics dashboards make it easier to track the right metrics efficiently, allowing your team to make data-driven decisions without getting bogged down in manual processes.
In Alloy Navigator, you have a powerful workflow automation engine at your disposal. It can help your team to automate the whole workflow and conveniently tie your help desk tickets to other processes in the company. For example, after the root problem is resolved, all associated tickets will be closed automatically and notifications will be sent. Users no longer need to remember complex change sequences to achieve specific outcomes. Our workflow automation streamlines processes, preventing cascading errors, minimizing redundant efforts, and significantly reducing troubleshooting time.
A help desk is the main point of contact between a company and its customers in need of assistance. In IT, a help desk specializes in troubleshooting software and hardware, product installations and configurations, and handling account or billing inquiries.
The term “help desk” is often confused with “service desk,” though they serve different purposes. A help desk primarily focuses on technical support and issue resolution, aiming to restore functionality as quickly as possible. A service desk, on the other hand, takes a broader approach by incorporating IT service management (ITSM), handling service requests, managing IT processes, and ensuring IT support aligns with business goals.
Help desk metrics are essential for tracking efficiency, improving processes, and enhancing customer satisfaction.
By monitoring speed and efficiency of ticket handling like response and resolution times, businesses can identify inefficiencies, optimize workflows, and offer targeted training.
Tracking the company’s workload and resource allocation helps balance team workload, prevent backlogs, and ensure optimal staffing levels.
Regularly reviewing service quality and customer satisfaction scores allows companies to refine support strategies, boost service quality, and strengthen customer loyalty.
Operational metrics provide insights into workflow efficiency, helping to refine ticket routing, minimize unnecessary escalations, and improve first-contact resolution rates.
To analyze help desk metrics effectively, focus on key goals like response time or CSAT, depending on your business needs. Comparing performance to industry benchmarks helps refine strategies while avoiding metric overload. Workflow automation streamlines help desk operations by reducing manual tasks, intelligently managing data, and ensuring seamless process automation for greater efficiency and accuracy.