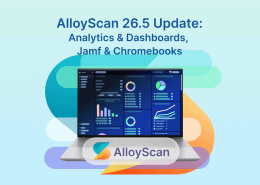
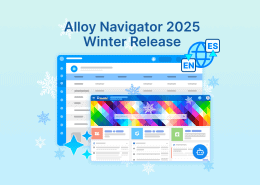
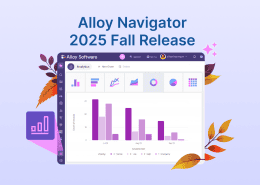
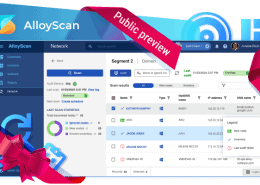
Expanded Analytics
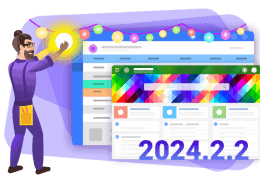
The interactive analytics introduced in Fall 2025 set a new standard for ITSM/ITAM reporting. This release takes them even further with new chart types, deeper customization, smarter navigation, and over 100 ready-made charts.
Track any metric, compare performance across time periods, monitor real-time activity, – and share insights with a single link.
In this release:
- Always know your numbers: Track KPIs at a glance with the new Counter widget and built-in trend indicators.
- A real-time pulse on your IT environment: Monitor system activity and user actions with a fully configurable activity view.
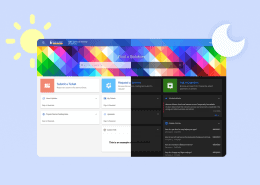
- Clear, customizable charts: Adjust colors, captions, and labels, so every chart is easy to understand.
- Faster navigation: Analytics are now organized into categories and subcategories.
- Instant sharing: Send any chart via direct link, no exports or screenshots needed.
Analytics are now more flexible and structured, and ready to answer any business questions.