Benefits of help desk reporting
Help desk reporting goes beyond numbers. It gives a clear view of your team’s performance and the overall health of support operations. By analyzing ticket trends, resolution times, and SLA compliance, you can identify recurring issues before they escalate, allocate resources effectively, and ensure high-priority requests are handled promptly. Reporting also demonstrates the value of your support function to management and supports continuous improvement, better decision-making, and higher service quality for users and customers.
Monitor and improve service quality
- Customer satisfaction: Analyze feedback from tickets and surveys to identify areas for improvement.
- Resolution times: Track average resolution times to find bottlenecks and optimize workflows.
- First contact resolution: Measure how many issues are solved on the first attempt to guide training and knowledge base updates.
Boost agent efficiency and motivation
- Workload balance: Monitor ticket volume per agent to optimize staffing and reduce burnout.
- Performance tracking: Evaluate resolution times and completed tickets to recognize top performers and address skill gaps.
Identify process issues
- Recurring problems: Detect frequently reported issues to address gaps in processes or resources.
- Ticket trends: Track ticket types and volume over time to identify areas needing process improvements or additional training.
Discover best practices
- Successful resolutions: Identify consistent solutions to standardize efficient practices across the team.
- Benchmarking: Compare metrics with past performance or industry standards to highlight strengths and improvement opportunities.
Help desk reporting with Alloy Navigator
Alloy Navigator, a leading ITSM and ITAM solution, provides a complete set of reporting tools for clear insights into IT operations and team performance.
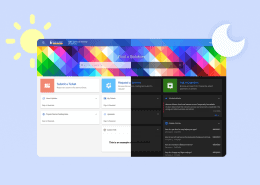
- Interactive Analytics
Over 40 ready-to-use charts allow teams to track key metrics like Resolution Time, Customer Satisfaction, and others. Users can quickly create custom charts with a simple interface, apply filters, and share or export results.
- Printable Reports
140+ ready-to-use reports cover all key IT support areas. Users can brand, customize, and schedule reports to deliver results automatically to stakeholders.
- Dashboards
Customizable dashboards let users arrange widgets, focus on relevant metrics, drill down into data, and share insights with colleagues.
- Data Views
Tabular views can easily be filtered, sorted, and summarized. Users can adjust them to highlight the most relevant data and share with the team.
These tools give IT teams a clear, actionable view of operations, trends, and resource allocation.