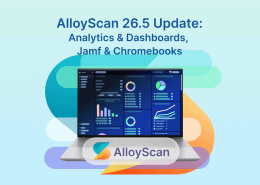
Analytics at your fingertips
Unlock the full potential of your ITSM and ITAM data! Instantly monitor ticket volumes and trends, track SLA compliance, evaluate the performance of your teams, and pinpoint resolution bottlenecks before they impact your service. The new Interactive Analytics turns your raw data into actionable insights, delivering fast, clear, and interactive visualizations to drive smarter decisions.
What you’ll love:
- Instant insights: Spot trends, monitor performance, and identify issues in real time
- Freedom: Build charts in minutes, no admin or external tools needed
- Flexibility: Switch between visualizations, summaries, and raw data
- Teamwork: Share interactive charts with your colleagues in Alloy Navigator
- Executive-ready: Export charts as images or tables to showcase results to managers and stakeholders
You start with 47 ready-to-use charts out of the box, and you can build as many custom ones as you need.