ITIL KPIs: The Complete Guide to Measuring What Actually Matters in IT Service Management
ITIL KPIs explained: how KPIs are defined in ITIL 4, what they measure, how to interpret them, and how AI enhances KPI insights.

ITIL KPIs explained: how KPIs are defined in ITIL 4, what they measure, how to interpret them, and how AI enhances KPI insights.
Are your IT metrics telling you what’s really happening—or just what looks good on paper?
In IT service management, this question comes up more often than it should. Organizations build KPI dashboards, track dozens of metrics, and generate regular reports. Yet somewhere between collecting the data and acting on it, clarity gets lost. Sufficient measurement doesn’t automatically lead to insights.
In this article, we will bridge that gap by learning to implement ITIL 4 KPIs in a practical, outcome-focused way. Whether you’re building a KPI framework from the ground up or refining what you already have, you’ll find practical guidance on choosing meaningful indicators, avoiding common pitfalls, and using KPIs as success factors for continual improvement.
Key Performance Indicators (KPIs) form the backbone of effective IT Service Management (ITSM). In the ITIL framework, KPIs serve as measurable indicators that help IT teams monitor performance, support data-drivendecision-making, and maintain visibility into how services and practices deliver value to the business.
However, ITIL KPIs are not simply numbers on a dashboard. They represent a structured approach to understanding system or service behavior and value creation within your IT environment.
The introduction of ITIL 4 significantly changed how organizations approach management KPIs measurement. Unlike ITIL v3, which often aligned standard metric sets with a structured service lifecycle, ITIL 4 integrates KPIs into the Measurement & Reporting practice within the broader Service Value System (SVS).
This shift emphasizes that KPIs should not serve as isolated targets, but as key indicators of how the entire IT service ecosystem creates value in support of business goals. Understanding this distinction is critical for anyone responsible for ITSM governance, continual service improvement, or IT operations management.
For a deeper look at how this systemic shift reshapes one of the core lifecycle stages, see our article on ITIL service design. It explores how design decisions, value streams, and service strategy align within the Service Value System, and why KPI thinking in ITIL 4 cannot be separated from how service management processes are designed from the start.

Many organizations fall into the same trap: they define KPIs at the practice level and only later attempt to connect them to meaning or value. ITIL 4 provides the set of best practices for defining KPIs that measure the efficiency and effectiveness of IT service management. Measurement should start with an understanding ofhow value is created through services and value streams, and how those value streams flow through the Service Value Chain, and only then translate that understanding into indicators.
Step 1: Anchor measurement in the value stream
Begin by identifying where the practice, service, or activity contributes to a value stream and what role it plays in value co-creation. At this stage, it is critical to separate internal activity from the outcome the value stream isdesigned to deliver as it moves through the Service Value Chain.
For example, Incident Management is not defined by the number of tickets processed. Within the Service Value System, its role is to support value streams by enabling rapid service restoration and minimizing businessimpact through the Deliver and Support activity of the Service Value Chain.
Step 2: Define outcomes in terms of value
Next, clarify what “success” looks like in the context of that value stream. Outcomes should be expressed in terms of service performance and business impact, not just operational efficiency or internal optimization. Thishelps align practice-level measurement with stakeholder value and organizational priorities.
Step 3: Select indicators that reflect system behavior
Only after value stream contribution and outcomes are clear should KPIs be selected. At this point, indicators are used to observe how effectively value streams flow through the Service Value Chain and whether practicesare enabling or constraining that flow.

When defined this way, an ITIL KPI becomes more than a reporting metric. It functions as a structured observation mechanism that supports continual improvement, learning, and informed decision-making across practicesand value streams, rather than a control or compliance tool.
If you want to make the most of your metrics for tracking efficiency, improving processes, and enhancing customer satisfaction, check out our article on help desk metrics. It gives an overview of commonly used metrics and explains how they translate into real-world support outcomes.
Rather than approaching KPIs as a collection of metrics or treating them as simple SLA compliance checks, ITIL measurement benefits from a focus on what each indicator reveals about system behavior. Grouping KPIs by measurement category clarifies their purpose andhighlights the different types of signals they provide.
The categories below form a coherent framework for working with KPIs across ITIL practices and value streams.
Usage KPIs focus on how services are actually consumed. They do not assess quality or efficiency directly, but they provide essential context about demand, adoption, and user behavior over time.
Common ITIL Usage KPIs include:
Usage KPIs are rarely sufficient on their own, but they provide the foundation for interpreting performance and capacity indicators.
Performance KPIs are used to assess how effectively a system delivers or restores services under load. In practice, these KPIs often bridge Service Level Agreements (SLAs) and Operational Level Agreements (OLAs), especially across service desk and support teams.
Common ITIL Performance KPIs include:
Performance KPIs reveal bottlenecks and delays, but they require quality and experience indicators to be interpreted correctly.
Follow us on LinkedIn for the latest product insights, feature previews, and more exclusive updates.
Capacity KPIs focus on whether resources are sufficient to meet current and future demand. In ITIL 4, capacity is not limited to infrastructure — it also includes people, suppliers, and process capability.
Common ITIL Capacity KPIs include:
Capacity KPIs help anticipate constraints before they affect service performance.
Quality KPIs focus on whether outcomes are stable, repeatable, and reliable. They measure service quality in a way that actually resolves underlying issues.
Common ITIL Quality KPIs include:
Quality KPIs provide an essential counterbalance to speed-focused performance metrics.
Experience KPIs capture how services are perceived by users and customers. They evaluate the quality of interaction rather than efficienct of IT service management alone.
Common ITIL Experience KPIs include:
Experience KPIs help identify gaps between formal performance and real-world perception.
Value KPIs focus on the relationship between services and business outcomes. They address whether the resources invested in service management meet the business goals.
Common ITIL Value KPIs include:
Value KPIs are often the most challenging to define, but they are essential for connecting IT service management to organizational goals.
A single KPI can reflect performance, capacity, and value at the same time. This overlap is a natural characteristic of service management systems and highlights their interconnected nature.
Organizing KPIs by measurement focus helps move beyond isolated metrics and toward a structured interpretation of system behavior and improvement opportunities.
When KPIs consistently focus on only one dimension, system-wide problems emerge:
This challenge directly relates to the ITIL 4 guiding principle: “optimize and automate”. Effective KPIs reveal overall system behavior rather than improving isolated components at the expense of others.
In our latest release we have introduced an AI-powered analytical tool designed to transform raw operational data into actionable insight through fast, clear, and fully interactive visualizations. Instead of relying on static reports or external BI tools, teams can work directly with live data inside the ITSM platform.
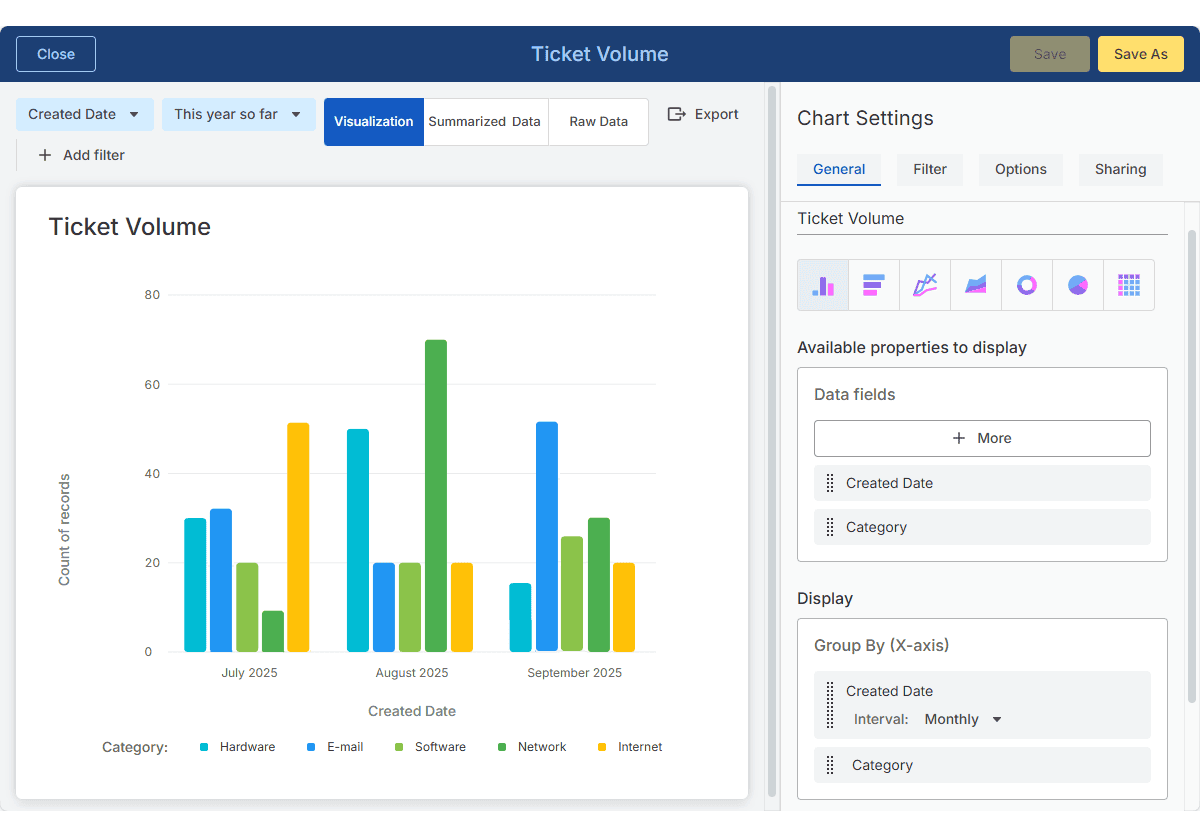
With Interactive Analytics, your team can:
Alloy Navigator provides 47 ready-to-use charts for common operational and service management scenarios, with the flexibility to create custom visualizations for specific KPIs, services, or value streams.
Traditional KPI measurement in ITSM typically follows a static model: indicators are defined upfront, thresholds are fixed, and reports are generated on a regular schedule. This approach provides consistency but assumes system stability that rarely exists in modern IT environments.
Artificial intelligence can visibly change KPI interpretation. Rather than introducing new metrics, AI enhances your ability to detect meaningful variation, especially where change is continuous and signals are rarely isolated.
Many ITSM environments display healthy KPIs in isolation: response times meet targets, SLA compliance is high, backlog appears stable. AI surfaces what’s harder to see—subtle variance shifts, emerging patterns over time, or correlations suggesting growing fragility before thresholds are breached.
When indicators are reviewed individually, local optimization often goes unnoticed. AI makes it easier to observe trade-offs between speed and quality, or detect how improvements in one practice create pressure downstream. This transforms KPIs from isolated measurements into a comprehensive picture of system behavior.
AI can identify leading indicators of service degradation before traditional lagging indicators show problems. This enables proactive intervention rather than reactive firefighting.
Despite its analytical and systematic capabilities, AI cannot compensate for poorly defined KPIs or unclear goals. It is most effective when goals and success criteria are clearly defined and when human judgment remains responsible for interpreting impact.
AI also cannot replace accountability. Measurement frameworks reflect organizational priorities, incentives, and constraints. Decisions about whether to prioritize speed over stability, efficiency over resilience, or short-term gains over long-term value are inherently organizational and contextual. AI can surface consequences, but it cannot determine which trade-offs are acceptable.
In this sense, AI should be viewed not as a corrective layer for weak KPI frameworks, but as an accelerator for well-designed measurement. While AI is well suited for analysis, interpretation, and prediction, responsibility for decision-making, assessing business impact, and maintaining a system-level perspective must remain with people.
Across organizations implementing ITIL practices, the same KPI patterns tend to repeat themselves. Most frequently they stem from a weak connection between KPIs and the Service Value System as a whole, rather than from poor management.
The mistake: KPIs are defined at the practice level before there is a shared understanding of the value the service is expected to co-create. As a result, metrics track activity, not outcomes, and remain disconnected from value streams.
The fix: Start by clarifying the intended outcome and value for stakeholders, then select KPIs that show whether the service and its value streams are actually contributing to that outcome.
The mistake: Measurement focuses on a single aspect of a practice without considering how it affects service quality, customer experience, or downstream practices. This violates the ITIL 4 principle of optimizing the whole.
The fix: Design KPIs that reflect multiple dimensions of performance and explicitly acknowledge trade-offs across practices and value streams.
The mistake: KPIs are treated as optimization goals rather than indicators of system behavior, pushing teams to “hit the number” instead of understanding what the system is telling them. Over time, this turns metrics into blunt instruments and erodes trust in measurement.
The fix: Use KPIs as input for continual improvement, helping teams interpret patterns, constraints, and variability within the Service Value System.
The mistake: Metrics are introduced primarily to enforce accountability, turning KPIs into performance pressure tools. People start managing impressions rather than outcomes.
The fix: Frame KPIs as shared signals that support collaboration, learning, and improvement across roles and practices.
The mistake: Individual practices are optimized without considering their impact on end-to-end value streams, leading to fragmented improvements and hidden bottlenecks.
The fix: Evaluate KPIs through a value-stream lens, ensuring improvements strengthen flow and value co-creation across the entire system.
Dealing with all these errors won’t be that difficult once you notice the root cause—treating KPIs as judgment rather than observation. Change that perspective, and suddenly your metrics start working for you instead of against you.
✓ Define clear goals and expected outcomes before selecting KPIs
✓ Balance effectiveness, efficiency, quality, and value in your measurements
✓ Classify KPIs by what they measure, not just where they’re applied
✓ Use KPI catalogs as references, never as mandatory checklists
✓ Leverage AI to enhance interpretation, not replace human judgment
✓ Treat KPIs as learning signals within continual improvement cycles
✓ Avoid single-dimension optimization and local improvements that harm the whole
✓ Focus on stable, repeatable system behavior as evidence of maturity
Effective ITIL KPI implementation requires a fundamental shift in perspective. KPIs aren’t standards to comply with or targets to hit—they’re observation tools that reveal how your IT service ecosystem creates value. At their core, they function as a language for describing system behavior, serving as essential inputs to continual improvement while connecting IT activity directly to business value. However, they are not universal standards, “correct” metric lists, or guarantees of maturity. Most critically, they are not substitutes for strategic thinking—no amount of measurement can replace the human judgment required to interpret what those measurements mean.
A good ITIL KPI doesn’t give easy answers. It asks better questions. The value lies not in the number itself but in the conversation and insight it enables—revealing patterns that warrant attention, highlighting trade-offs that require decisions, and exposing assumptions that need testing. This distinction defines how KPIs should be used: as signals for learning rather than mechanisms of control.
When organizations implement KPIs that reflect meaningful outcomes across multiple dimensions and interpret them in context rather than isolation, metrics transform from compliance overhead into genuine drivers of service excellence. This is the promise of ITIL 4’s approach to measurement—not more metrics, but better questions; not universal standards, but contextual intelligence; not judgment, but observation that makes system behavior visible and helps IT services deliver the value that the business actually needs.